Racial Bias in Facial Recognition: The Role of Training Data and Human Prejudice
 Photo by rawpixel on Unsplash
Summary
This project investigates how dataset imbalance and annotator prejudice contribute to racial bias in facial recognition systems.
Study 1-2 focuses on how training data diversity affects model performance across racial groups.
Study 3 examines how human bias in labeling influences classification accuracy, integrating psychological measures with deep learning pipelines.
Key Findings
- Imbalanced datasets reduced categorization accuracy for underrepresented racial groups, especially racially ambiguous faces.
- Annotator bias was embedded in the training pipeline, leading to misclassification patterns that reflected human prejudice.
Team & Collaboration:
- Jeff J. Berg, Ph.D., New York University
- David M. Amodio, Ph.D., University of Amsterdam & New York University
Goal
To understand how training set balance and human social biases shape the fairness of AI models—bridging psychology and computer vision to uncover where inequality truly originates in algorithmic decision-making.
Why it matters
- Reveals how bias originates in human labeling, not just in algorithms.
- Provides insight for building responsible, fair, and interpretable AI systems.
- Encourages interdisciplinary collaboration between psychology and machine learning to design socially aware technologies.
Challenge
Training Set Imbalance (Study 1–2):
- Navigate the abundance of existing face datasets and determining which best fit research goals.
- Handle scale with automation—ingestion, labeling, and file movement for millions of face images.
- Need to move beyond monoracial test sets; evaluate performance on racially ambiguous and multiracial faces to reflect real-world diversity.
Addressing Human Annotator Bias (Study 3):
- Determine whether human bias—beyond dataset imbalance—contributes to bias observed in AI systems.
- Integrate psychological data into machine learning pipelines.
- Develop automated systems to collect large-scale human data and prepare it efficiently for model training.
Solutions to the challenge
Training Set Imbalance (Study 1–2):
- Reviewed and compared existing datasets to analyze their racial composition and representation.
- Built custom Python scripts for automation (image handling, labeling, and organization)—pre-LLM based AI Assistant era, learning primarily from Stack Overflow.
- Generated racially ambiguous faces using WebMorph to bridge gaps in existing datasets.
Addressing Human Annotator Bias (Study 3):
- Statistically controlled for annotator bias to isolate human contributions to AI bias.
- Launched large-scale data collection on MTurk to gather annotations from diverse human participants.
- Coded automation pipelines for data handling and processing (pre-LLM AI Helper era, learned primarily from Stack Overflow).
Study 1-2: Dataset Imbalance
Research Process
Stage 1: Identifying the Problem
- Challenge: Automated face classification models frequently misclassify non-White faces due to biased training datasets.
- Key Question: How does dataset racial balance affect a model’s ability to accurately classify both monoracial and mixed-race faces?
- Psychological Context: Reflects findings from social categorization research—biased exposure skews perceptual boundaries, analogous to biased data exposure in AI.
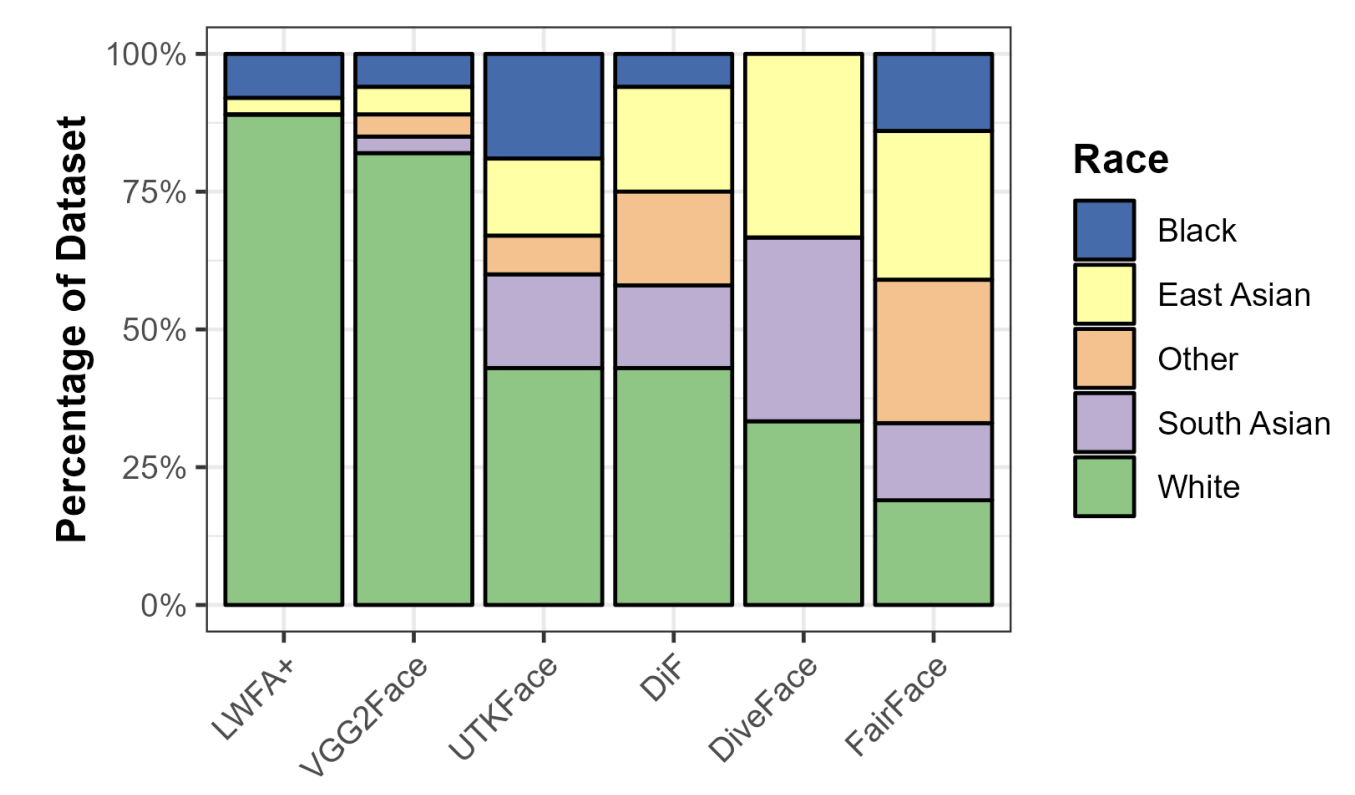
The racial compositions of the most popular publicly available face image datasets
with race annotations.
Stage 2: Developing the Study Design
- Objective: Examine how dataset diversity, independent of dataset size, influences classification performance.
- Approach:
- Study 1: Tested overall race/gender classification accuracy across datasets.
- Study 2: Examined racial ambiguity via mixed-race face morphs.
- Datasets:
- UTKFace: ~23,000 images, overrepresenting White and male faces.
- FairFace: ~108,000 images balanced across racial and gender categories.
- Programming Environment:
- Implemented in Python using PyTorch (for deep learning) and NumPy / Pandas (for data handling).
- Visualizations generated with Matplotlib and Seaborn for plotting classification accuracy and with R and quickpsy package for PSE curves.
- Model Architecture: All experiments used ResNet-50, pretrained on ImageNet, retrained on customized datasets.
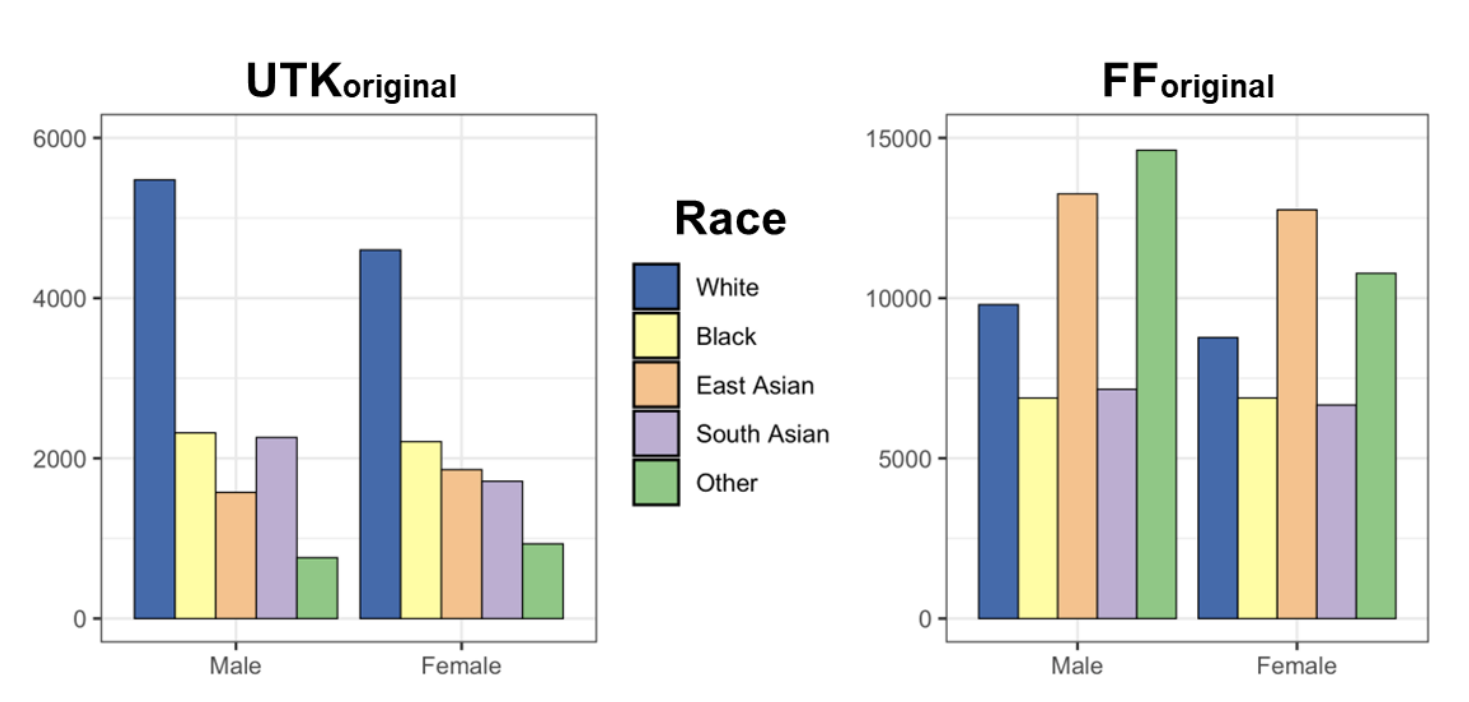
Demographic composition of the original UTKFace dataset (FForiginal) and the original
FairFace (UTKoriginal) dataset.
Stage 3: Dataset Training
- Gathered 40,000+ face images from both UTKFace and FairFace.
- Constructed balanced and size-matched subsets to disentangle effects of diversity vs. dataset size.
- Generated mixed-race face morphs (Black↔White continuum) for Study 2 to test classification thresholds.
Stage 4: Analysis
- Metrics:
- Race and gender classification accuracy.
- Race × gender interaction effects.
- Point of Subjective Equality (PSE): Morph level where faces are equally likely to be labeled Black or White.
- Comparisons:
- UTKFace vs. FairFace models.
- Balanced vs. unbalanced subsets.
- Male vs. female face classifications.
More on analysis strategy
- Generated racially ambiguous faces using webmorph.org by Dr. Lisa DeBruine
- Quantified the effect of dataset diversity on classification of racially ambiguous faces using Points of Subjective Equality (PSEs).
- PSE indicates the morph point at which a face is equally likely to be classified as Black or White:
- 50% PSE → classification matches morph composition.
- <50% PSE → face is classified as Black with less than 50% Black content (hypodescent pattern).
- Computed PSEs for two models trained on different datasets (UTKoriginal vs. FForiginal) to assess dataset influence.
- Analyses implemented in R using the quickpsy package.
Stage 5: Results
- Accuracy: Balanced datasets (FairFace) produced higher cross-group accuracy and fewer racial misclassifications.
- Bias Direction: UTKFace-trained models showed systematic over-classification of White faces and under-classification of Black faces.
- Ambiguity Sensitivity:
- Imbalanced models classified mixed-race faces as White until ~70–80% Black composition.
- Balanced models’ PSEs approached 50%, aligning more closely with perceptual reality.
- Stability: PSE values ranged widely (30–93%) across data subsets, showing extreme sensitivity to sampling bias.
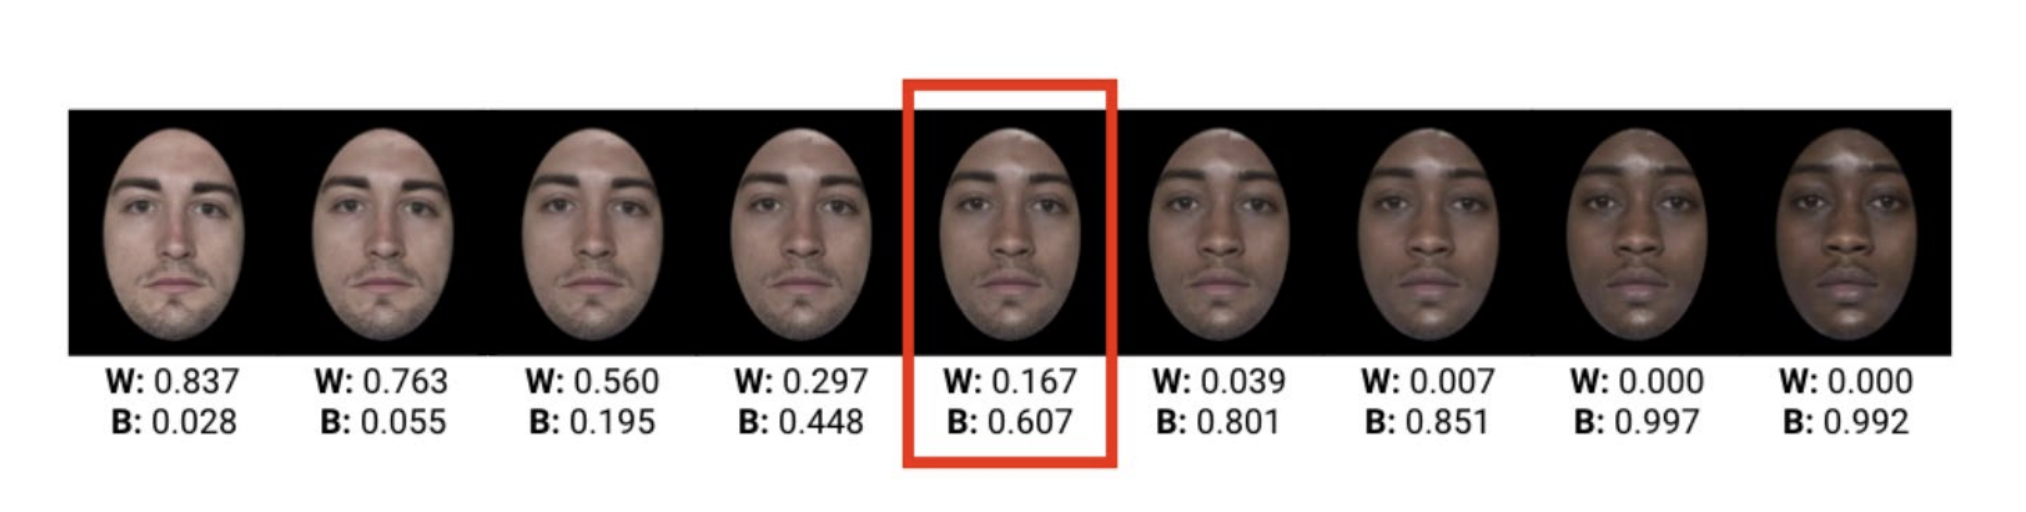
Example of White and Black race classification probabilities for a single face morph
spectrum (as classified by the UTKoriginal model).
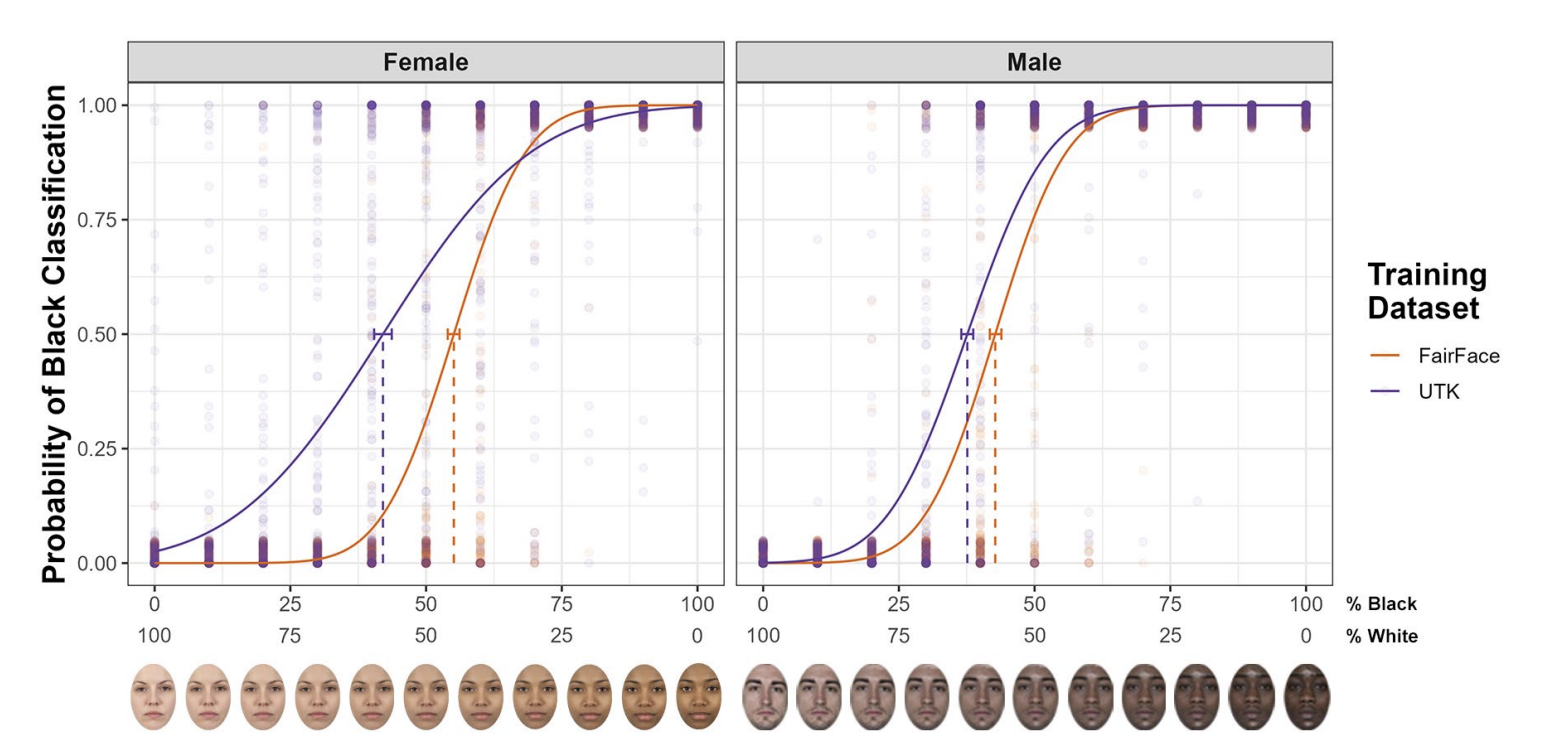
Separate PSE curves for the model trained on the original UTKFace dataset
(UTKoriginal) and the model trained on the original FairFace dataset (F Foriginal), separately for male
faces and for female faces. The error bars represent the 95% confidence interval around the PSE
for each gender category.
Stage 6: Interpretation
- Core Finding: Dataset racial diversity—not size—determines fairness and perceptual accuracy.
- Psychological Parallel: Similar to own-race bias in human face perception—exposure diversity improves perceptual generalization.
- UX Implication: Data representativeness is a design decision, shaping user-facing fairness and trust outcomes.
- Ethical Takeaway: Diversity audits should be built into the dataset design process, much like user diversity testing in UX workflows.
STUDY 3: Annotator Prejudice Propagation
Research Process
Stage 1: Identifying the Problem
- Challenge: Even with balanced datasets, human labelers may inject bias through subjective demographic judgments.
- Key Question: How do individual prejudice levels among annotators affect the racial labeling of faces and downstream model behavior?
- Psychological Context: Builds on decades of research showing that prejudice alters categorical perception and ambiguous face processing.
Stage 2: Developing the Study Design
- Objective: Quantify how annotator racial prejudice influences face classification models.
- Approach:
- Recruit annotators with varying prejudice levels (measured via validated psychological scales).
- Have each group label identical faces by race.
- Train models separately on high-prejudice and low-prejudice label sets.
- Focus: Observe how label bias affects both accuracy and sensitivity to racial ambiguity.
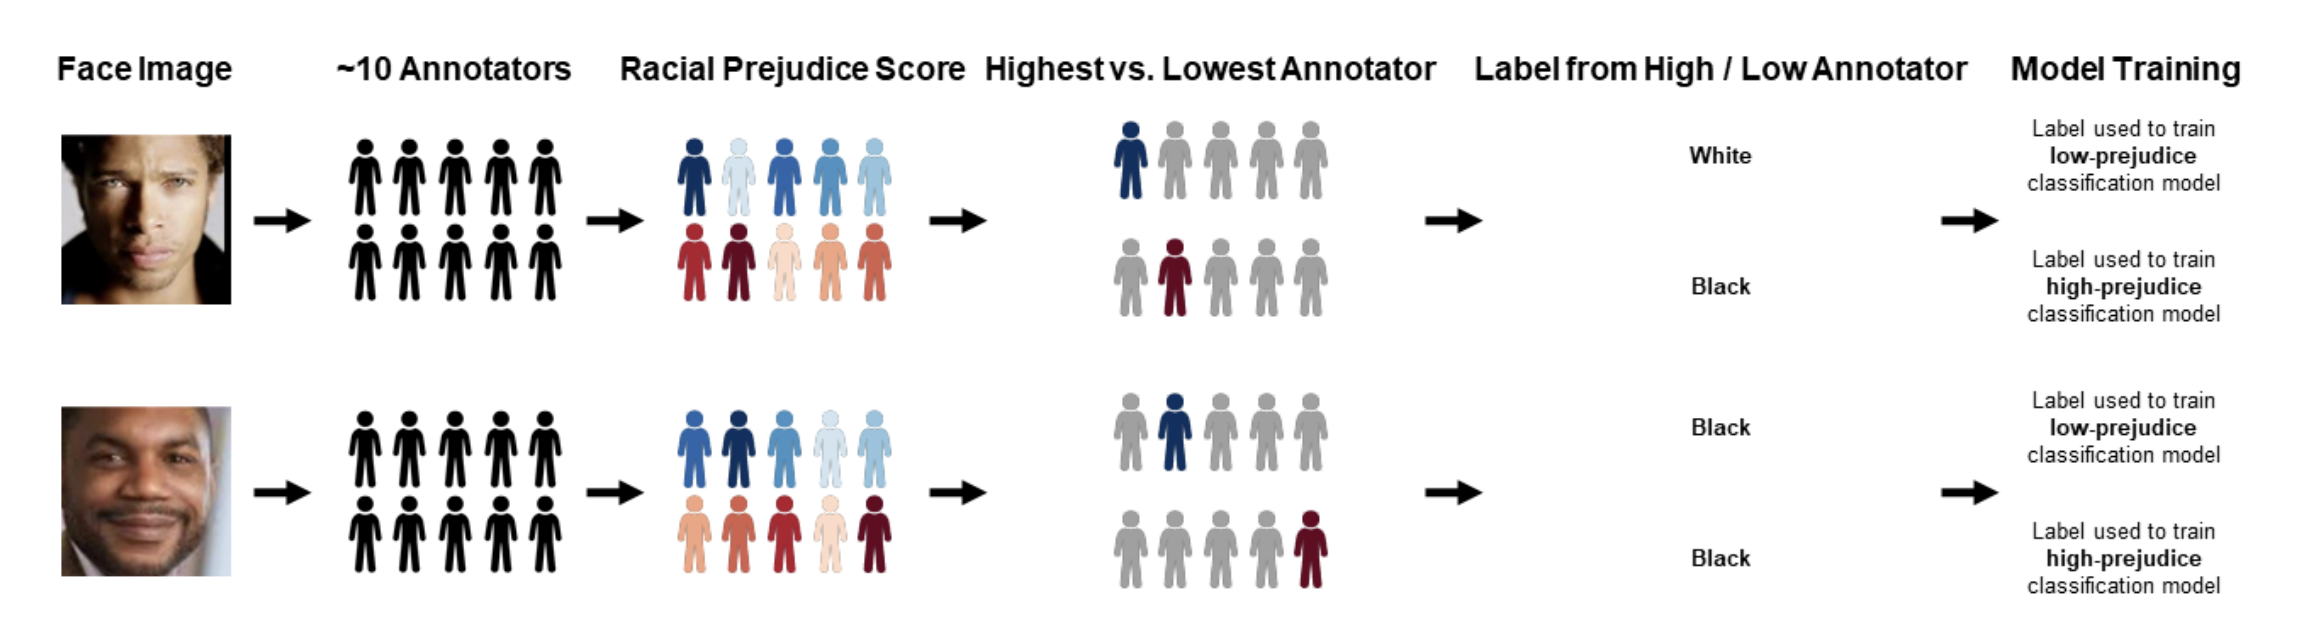
Schematic design of the study's face label division and model-training processes.
Stage 3: Data Collection
-
Recruitment Platform:
Participants were recruited via Amazon Mechanical Turk (MTurk) using the Cloud Research platform, which ensured high-quality data collection and demographic diversity across annotators. -
Target Structure:
The study aimed to obtain at least 10 annotators per image set, with 100 unique image sets total (each set included 160 images, representing every combination of race × gender). -
Final Sample Size:
- Total Recruited: 1,203 annotators
- Valid Participants after exclusions: 1,196
- Label Output: 192,480 race labels and 192,480 gender labels
-
Annotator Demographics:
- Gender: 539 female, 648 male, 9 non-binary or other
- Race:
- 953 White
- 100 Black
- 21 Chinese
- 13 Asian Indian
- 12 Filipino
- 10 Korean
- 31 “Other”
- 56 Multiracial
- Age: Mean = 39.5 years, SD = 11.3 (Range: 19–79)
-
Analytic Subsample for Focal Analyses:
To examine the effects of racial prejudice on labeling and model bias, only White monoracial annotators (N = 953) were included in the main analysis. This decision follows precedent from social perception literature that focuses on how dominant-group biases influence classification accuracy. -
Annotator Assessments:
Each annotator completed a demographic, experiential, and psychological profile including measures of racial attitudes and prejudice.- Key Psychological Variable: Self-reported racial prejudice, assessed through feeling thermometers toward four racial groups (White, Black, East Asian, South Asian).
- Derived Index: The prejudice score was computed as the difference between warmth toward Whites and the mean warmth toward non-White groups, where higher scores indicate greater prejudice.
-
Programming Environment:
Data collection and stimulus presentation were implemented using a Python-Flask web interface (see screenshot below). -
Analytic Note:
The data collection design allowed the creation of separate face label datasets (high-prejudice vs. low-prejudice), enabling causal testing of how annotator bias propagates through training data into algorithmic classification errors.
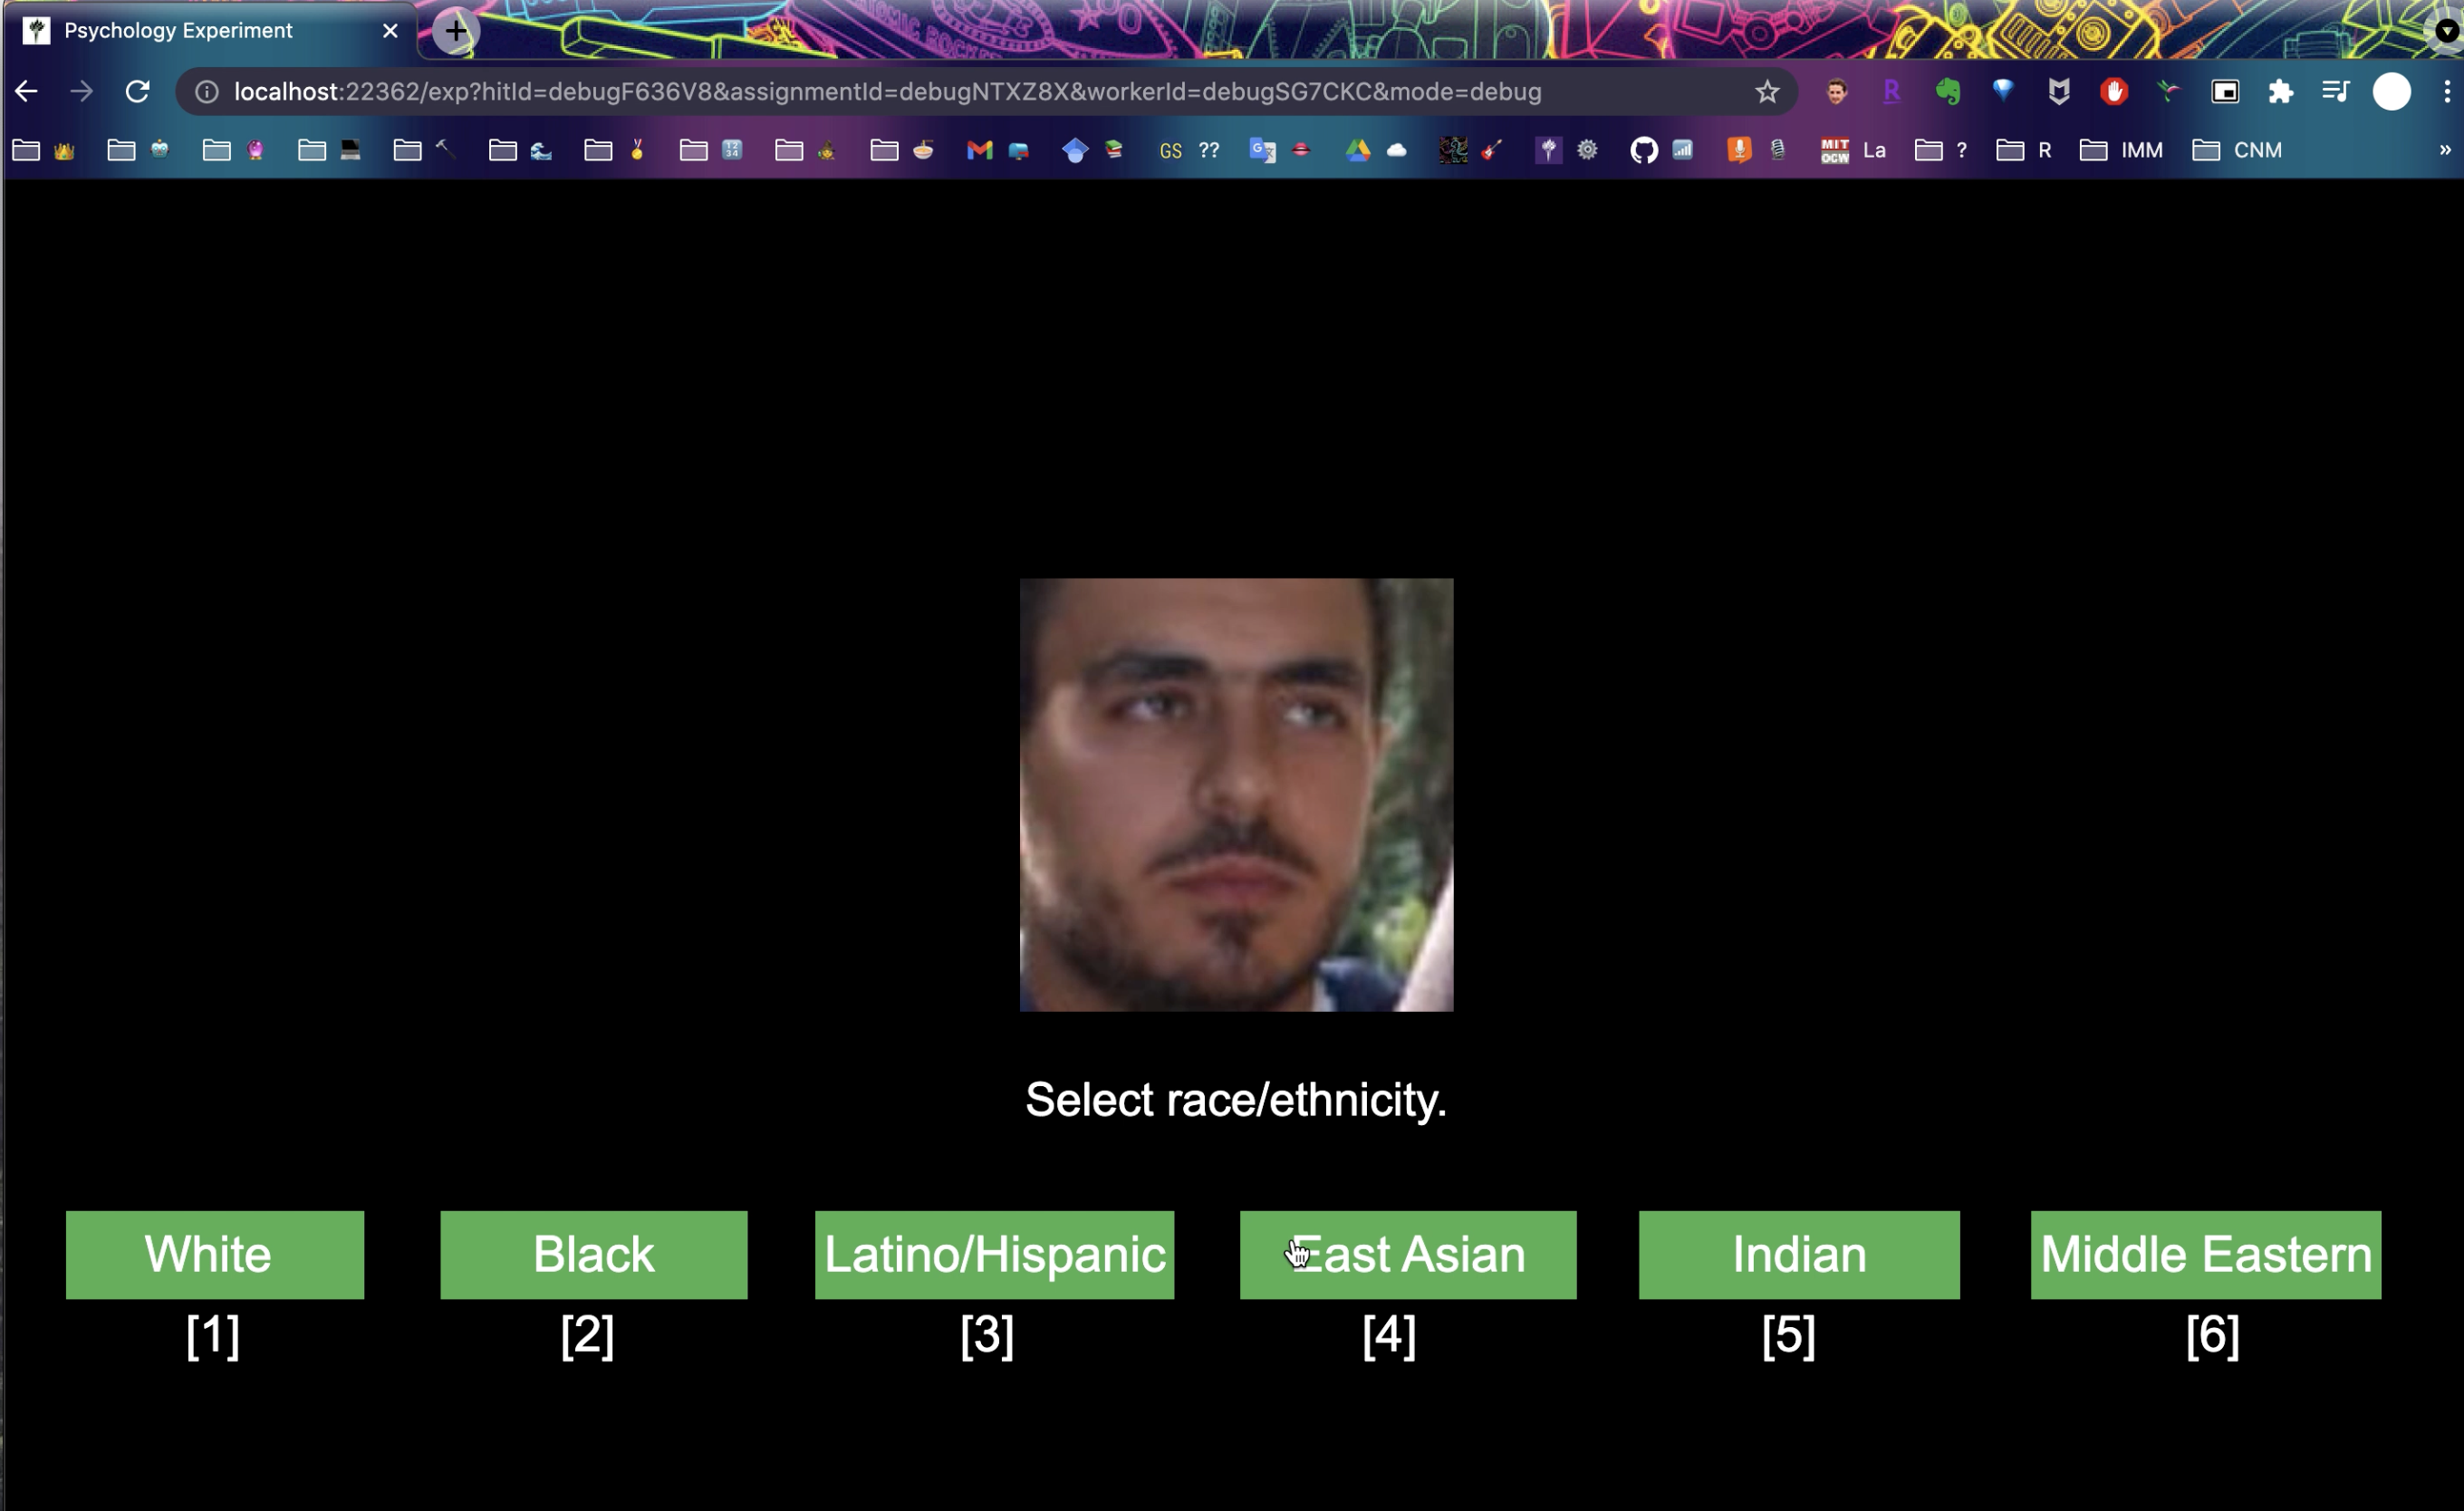
Screenshot of web interface for Annotation Task
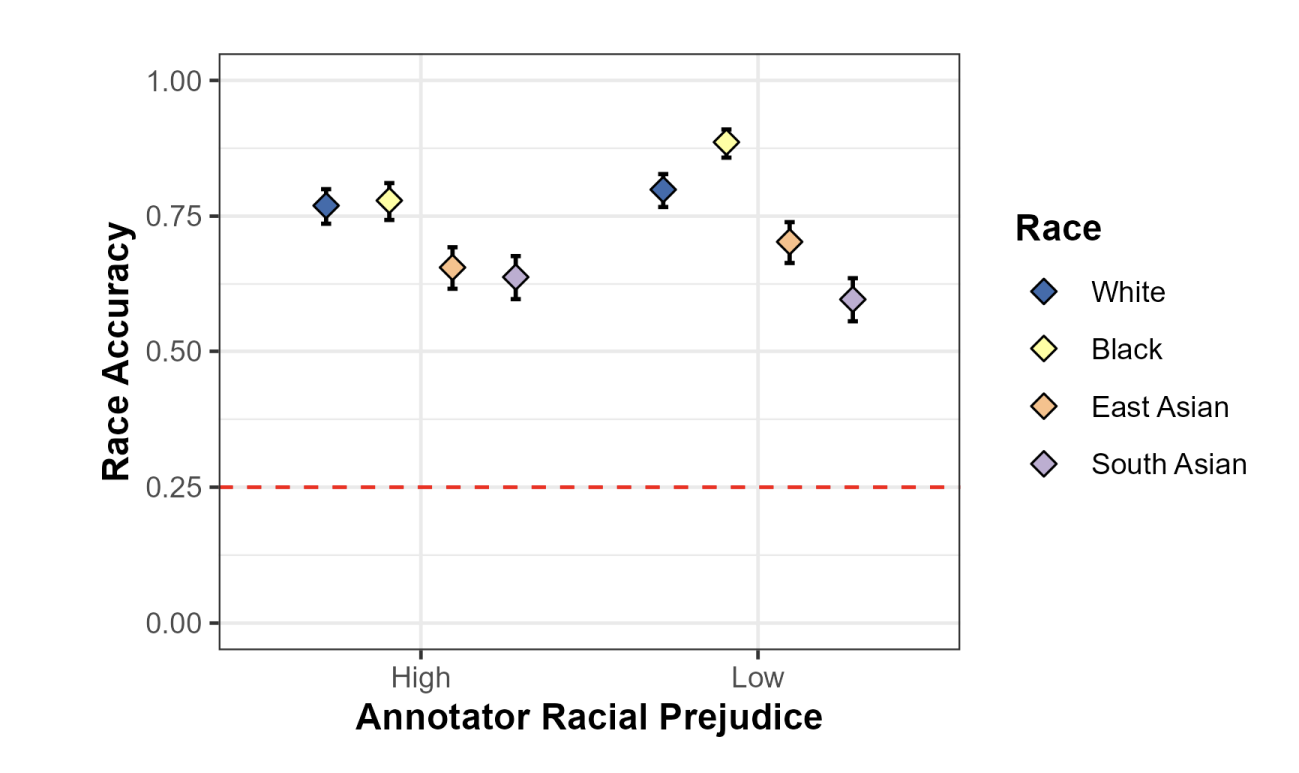
Race-specific race classification accuracy rates for the high-prejudice model and low-
prejudice model, when tested on the held-aside test set with labels from the same annotator
groups (high-prejudice versus low-prejudice). The error bars represent the 95% confidence
interval around the average accuracy rate for a given combination of face classification model
and racial group..
Stage 4: Analysis
- Programming Tools:
- Python (PyTorch, Pandas).
- Statistical comparisons using R (for between-group analyses and significance testing).
- Metrics:
- Race classification accuracy on held-out data.
- Accuracy on mid-prejudice label validation sets.
- PSE curves for mixed-race morph stimuli.
- Label agreement rates across annotator groups.
- Analytic Comparisons:
- High- vs. low-prejudice models.
- Accuracy differences by race category.
- Boundary shifts in ambiguous classification (PSE displacement).
- PSE Score Analysis Plan
- PSEs were computed for each morph continuum and then averaged within each model type:
- Mean PSE for low-prejudice model
- Mean PSE for high-prejudice model
- Used nonparametric bootstrapping (1,000 samples) to estimate 95% CIs and compare mean PSEs.
- Model differences inferred from non-overlapping confidence intervals.
- PSEs were computed for each morph continuum and then averaged within each model type:
Analysis Detail
- Generated racially ambiguous faces using webmorph.org by Dr. Lisa DeBruine
- Quantified the effect of dataset diversity on classification of racially ambiguous faces using Points of Subjective Equality (PSEs).
- PSE indicates the morph point at which a face is equally likely to be classified as Black or White:
- 50% PSE → classification matches morph composition.
- <50% PSE → face is classified as Black with less than 50% Black content (hypodescent pattern).
- Computed PSEs for two models trained on different datasets (UTKoriginal vs. FForiginal) to assess dataset influence.
- Analyses implemented in R using the quickpsy package.
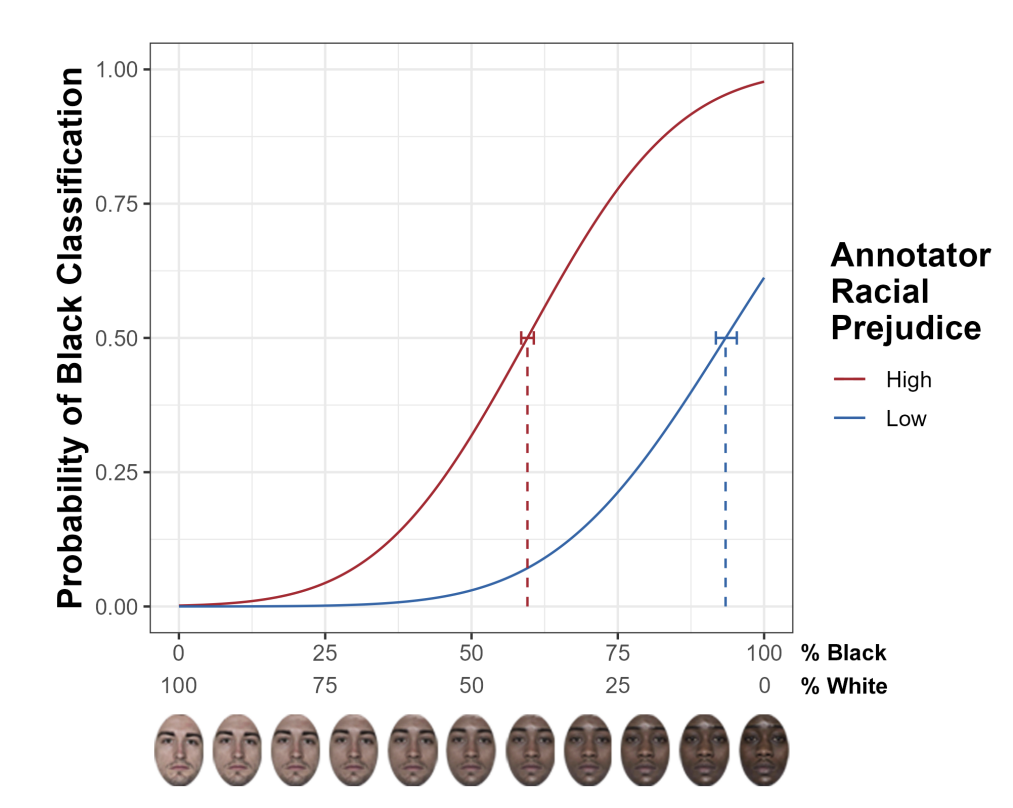
PSE curves for the model trained on the high-prejudice annotator labels (high-
prejudice model) and the model trained on the low-prejudice annotator labels (low-prejudice
model). The error bars represent the 95% confidence interval around the PSE for each model.
Stage 5: Results
-
Race Classification Accuracy:
- Significant main effect of face race on accuracy (χ² = 36.6, p < .001).
- Average accuracy across models:
- Black faces — 79.6%
- White faces — 75.4%
- East Asian faces — 64.1%
- South Asian faces — 58.6%
- Model × Face Race Interaction: χ² = 30.4, p < .001
- Low-prejudice model: 85.1% accuracy for Black faces (95% CI [81.9%, 87.7%])
- High-prejudice model: 72.7% accuracy for Black faces (95% CI [69.0%, 76.1%])
- Difference significant at p < .001
- No significant accuracy differences for White (p = .982), East Asian (p = .344), or South Asian (p = .088) faces.
-
Ambiguity Sensitivity (PSE Analysis):
- Analyzed 4,180 Black–White morph images ranging from 0–100% racial composition.
- PSE = morph level with equal (.5) classification probability for Black vs. White.
- High-prejudice model:
- Showed lower PSE, labeling faces as “Black” even with less Black facial content.
- Reflected a steeper, more categorical boundary in race perception.
- Low-prejudice model:
- Displayed smoother, more continuous PSE transitions, indicating flexible boundary detection and higher fairness in ambiguous classifications.
-
Bias Propagation:
- Annotator-level prejudice measurably altered the model’s internal race classification boundary.
- Bias effects were strongest for Black faces, consistent with U.S. racial salience hierarchies.
- Demonstrated that social bias is not random noise—it’s a quantifiable variable that directly impacts model performance.
- Models trained on low-prejudice labels showed better cross-racial generalization when tested on mixed-prejudice label sets.
Stage 6: Interpretation
-
Core Insight:
Human social prejudices are systematically transmitted to machine learning systems through the labeling process, shaping how algorithms perceive and categorize race. -
Psychological Parallel:
Mirrors cognitive findings that implicit and explicit prejudice narrow perceptual boundaries—machines “inherit” this perceptual compression when trained on biased human data. -
Technical Implication:
Even identical architectures (ResNet-50) diverge in fairness outcomes solely due to human label source differences—emphasizing that training data quality is a psychological, not just computational, variable. -
UX and Ethical Design Lesson:
- Treat data annotation as a human-factors design challenge rather than a purely technical step.
- Implement bias audits, annotator diversity training, and label documentation as part of UX-oriented ethical curation workflows.
- Integrate fairness monitoring early in model development—analogous to usability testing in UX research.
Stage 7: Broader Implications
The study offers empirical evidence that reducing human prejudice in labeling improves algorithmic fairness, demonstrating how psychology and machine learning must co-design ethical AI systems.
Programming & Tools Summary
| Stage | Programming Language/Software | Key Libraries / Methods |
|---|---|---|
| Data Collection | Python(Flask Web App), HTML/CSS | Flask for task interface; data hosted via Cloud Research/MTurk integration |
| Data Cleaning | Python | Pandas, NumPy, regex for preprocessing and cleaning annotator label files |
| Model Training & Evaluation | Python | PyTorch for ResNet-50 training |
| Statistical Analysis | R & Python | R (quickpsy), Python (SciPy, bootstrapping routines) for accuracy and R (quickpsy) PSE comparisons |
| Visualization | Python & R | Matplotlib, quickpsy and ggplot2 for plotting classification accuracy and PSE curves |