NLP-Driven Insights into Queer Sentiment During Legal Milestones
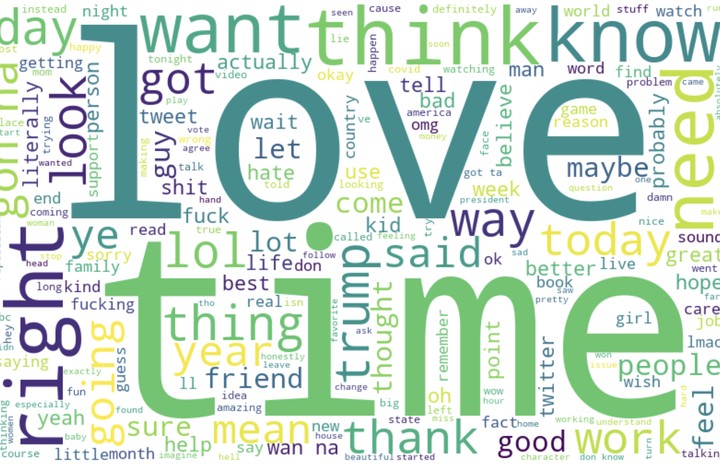 word cloud by me
Summary:
-
Leveraging advanced natural language processing techniques, this project investigates long-term emotional expression among openly queer users on Twitter (now X.com) from 2012 to 2017. The analysis spans two landmark U.S. Supreme Court rulings on same-sex marriage (2013, 2015), revealing how sentiment patterns evolved in response to major sociopolitical events.
-
Key findings: LGBTQ+ users expressed more positive emotions than non-LGBTQ+ users, suggesting emotional resilience and the supportive nature of digital communities during major political events.
Team & Collaboration:
- Kyle Ratner Ph.D. UC Santa Barbara
Challenge
- Identifying relevant users: I needed a rough but reasonable way to detect Twitter users who were openly LGBTQ+ or discussing their identity (e.g., using emojis, hashtags, or self-descriptions such as 🏳️🌈).
- Establishing user-centered relevance: The study addresses a research gap in understanding how queer emotional expression evolves over time in response to sociopolitical events — a need often overlooked in sentiment and visibility research.
- Data scale and accessibility: Managing millions of tweets required building a custom web scraper and designing efficient data pipelines.
- Computational constraints: Running BERT-based sentiment analysis on such a large dataset demanded substantial compute resources and optimization strategies.
Solutions to the challenge
- User detection pipeline: Wrote custom Python scripts to extract user profile metadata and identify openly LGBTQ+ users based on self-descriptions, emojis, and hashtags.
- Web scraping infrastructure: Customized the open-source Twint package to build a scalable Twitter scraper, distributed across multiple lab machines for parallel data collection.
- High-performance sentiment analysis: Leveraged UCSB’s High Performance Computing (HPC) cluster to run BERT-based sentiment models efficiently, overcoming the limitations of personal hardware.
Goal
At its core, the goal was to understand the affective experiences of LGBTQ+ users through their digital expressions — seeing online sentiment as one potential signal of long-term well-being in the face of systemic change.
Why it matters
- Understand how government rulings shape public discourse and online emotions.
- Explore whether structural events like court rulings contribute to community resilience or distress among stigmatized groups.
- Assess whether sentiment on social media can serve as a proxy for public well-being.
Research Process
Stage 1: Identifying the Problem
- Reviewed prior literature showing that queer individuals report higher rates of depression, anxiety, and reduced emotional well-being, often linked to structural stigma and social exclusion.
- Noted that major legal rulings—such as those affirming same-sex marriage—can shift public norms, reduce perceived stigma, and potentially promote better mental health outcomes.
- Identified a gap in existing research: while emotional spikes around rulings are well-documented, few studies examine long-term emotional trajectories among stigmatized communities.
- Hypothesized that following landmark rulings, openly queer users would display more positive sentiment in the years after the ruling compared to the years before—reflecting increased visibility, solidarity, and resilience.
- Defined the central research question:
How does queer emotional expression shift online in response to major government rulings??
Stage 2: Study Design
- User focus: Targeted everyday openly LGBTQ+ users with fewer than 1,000 followers to minimize bias from influencers or institutional accounts.
- User categorization: Identified openly LGBTQ+ users through profile cues such as emojis, hashtags, and bio descriptions.
- Pilot phase:
- Tested keyword filters and categorization logic on small data subsets.
- Refined classification to ensure clear differentiation between user types and ruling periods.
Data Collection Strategy:
- Scraped tweets referencing key rulings using hashtags like
#SCOTUSand#LoveWins. - Compiled a list of users who engaged with these rulings.
- Scraped all tweets from these users between 2012–2017, forming a longitudinal dataset.
- Processed tweets using BERT to generate a sentiment score for each tweet.
- Calculated average sentiment scores per user per year (2012–2017).
- Categorized users’ sexual orientation based on profile cues (e.g., 🌈 emojis, hashtags, bios) and tweet content (e.g., “coming out”).
- Included only non-influencer accounts (<1,000 followers) to preserve everyday emotional expression.
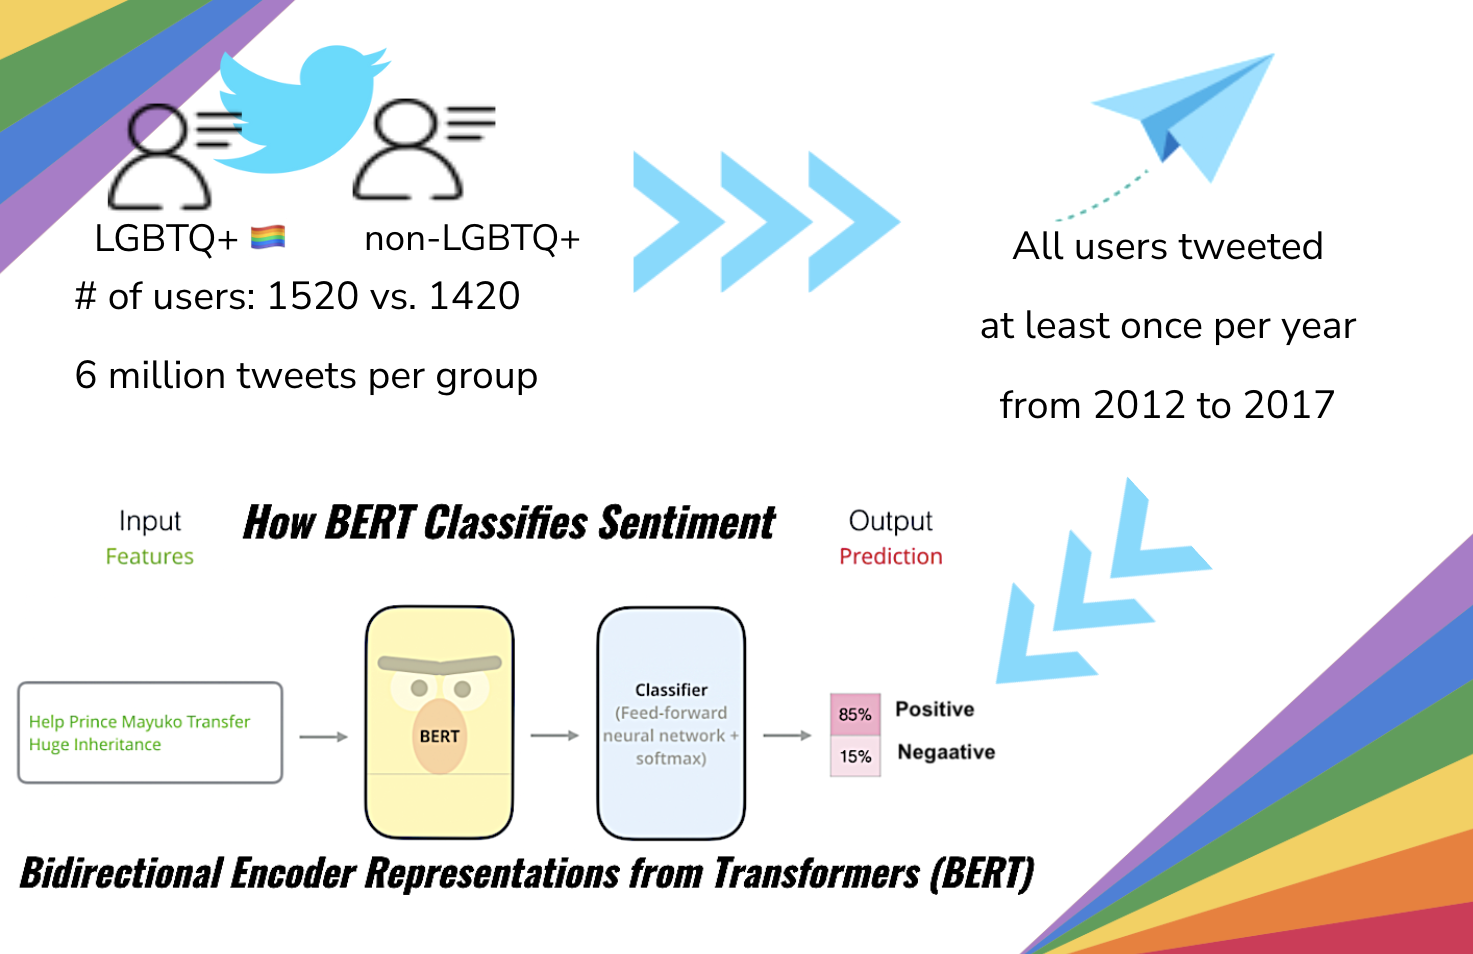
Schematic Design
Stage 3: Data Collection
Programming Language: Python
- Libraries & Tools:
- Twint + Twitter API for data scraping
- Pandas, NumPy for data cleaning
- OpenAI’s BERT for sentiment scoring
- Dataset:
- Collected ~12 million tweets from 2950users (1520 openly LGBTQ+ users).
- All users tweeted at least once per year from 2012 to 2017
- Users identified through hashtags like
#SCOTUSand#LoveWins. - Inclusion criteria: Tweeted at least once per year (2012–2017), with U.S. location specified.
- Category Identification:
- Users self-identified as openly LGBTQ+ via emojis, profile text, or hashtags (e.g., 🏳️🌈).
- Others classified as non-openly LGBTQ+ as a comparison group.
- Final Dataset for Analysis: Focused on 2013 and 2015, the two key ruling years.
Stage 4: Analysis
- Sentiment Scoring:
- BERT model fine-tuned for sentiment classification.
- Tokenized tweets → context-aware embeddings → sentiment scores (−1 = negative; +1 = positive).
- Statistical Modeling:
- Linear Mixed Models in R.
- Random intercepts for “username” to capture within-user variation.
- Fixed effects: Month, Category (LGBTQ+ vs. Non-LGBTQ+), and their interaction.
- Analytic Focus:
- Temporal trends in positivity.
- Comparison across ruling months (especially June, July).
- Evaluation of within-group sentiment variability.
Stage 5: Results
2013 Ruling
- Openly LGBTQ+ tweets were more positive overall (β = 0.1651, p < .001).
- Significant monthly variation, with peaks around June–August (the ruling period).
- However, from July–October, LGBTQ+ sentiment declined, showing less positivity than non-LGBTQ+ users.
- Interpretation: The initial uplift from the ruling might have been tempered by backlash, social debate, or continuing discrimination.
2015 Ruling
- Openly LGBTQ+ users again showed higher baseline positivity (β = 0.156, p < .001).
- Sentiment rose in June (ruling month) but dropped sharply July–December (βs between −0.02 to −0.04, p < .001).
- Possible Explanation: Post-ruling backlash or lingering interpersonal discrimination may have dampened long-term emotional benefits.
Additionally, seasonal trends were observed, including a sentiment dip in 2016 (possibly linked to Trump’s election)
Interactive Visualization of Sentiment Trends (2012–2017)
Explore monthly sentiment patterns among LGBTQ+ and non-LGBTQ+ users before and after key Supreme Court rulings.
Hover over the plot to view average sentiment scores and sentiment shifts
🔍 Open in full screen
Stage 6: Interpretation
- Unexpected Finding: LGBTQ+ tweets were generally more positive overall, contradicting assumptions about persistent negative affect due to marginalization.
- Possible Explanation: Reflects community resilience and positive self-expression patterns online.
- Psychological Context: Aligns with research showing minority group resilience (e.g., Crocker et al., 1994).
- Temporal Dynamics: Institutional recognition (rulings) may shift perceived norms rather than emotional tone—positivity spikes may be short-lived.
- Social Implications: Legal wins may not immediately alleviate interpersonal discrimination or structural stigma.
Reflection
- The study highlights how digital platforms serve as emotional ecosystems—spaces for both coping and celebration.
- Offers evidence that social media can amplify positive affect within stigmatized communities following structural change.
- Future steps include:
- Comparing emotional trends across specific LGBTQ+ subgroups (e.g., gay vs. lesbian users).
- Exploring non-verbal communication (emoji use, visual media).
- Linking online sentiment to offline well-being indicators (e.g., community health metrics, survey data).
Programming & Tools Summary
| Stage | Programming Language | Key Libraries / Methods |
|---|---|---|
| Data Collection | Python | Twint, Twitter API |
| Data Cleaning | Python | Pandas, NumPy, regex |
| Sentiment Analysis | Python | BERT |
| Statistical Analysis & Visualization | R & Python | statsmodels, lme4, scipy |